Low income countries account for only 3% of global road networks: a constraint for economic growth

An analysis of road network data from IRF World Road Statistics (WRS) reveals the low percentage of road networks in low income countries and underdeveloped regions of the world. These results link poor quality roads and lack of road infrastructure to constrained economic development and growth The IRF World Road Statistics (WRS) includes up-to-date data on the road and transport sector for over 200 countries and covers nine important road topics, one of which is road networks. An analysis of the road
January 15, 2019 Read time: 3 mins
Source: IRF WRS 2018, latest year of available data for countries
An analysis of road network data from IRF World Road Statistics (WRS) reveals the low percentage of road networks in low income countries and underdeveloped regions of the world. These results link poor quality roads and lack of road infrastructure to constrained economic development and growth


The 1201 IRF Geneva World Road Statistics (WRS) includes up-to-date data on the road and transport sector for over 200 countries and covers nine important road topics, one of which is road networks.

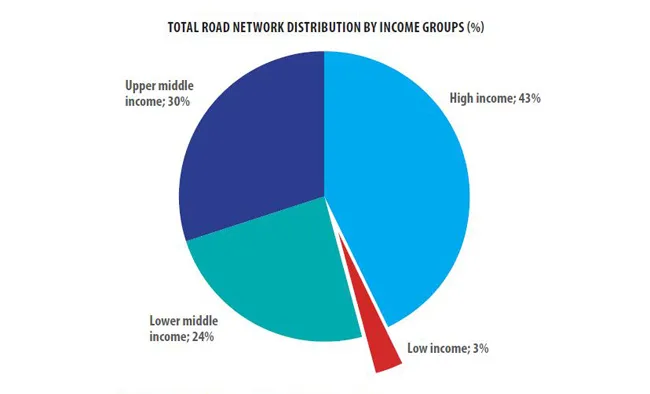
An analysis of the road network data reveals that low income countries account for just 3% of global road networks. With such a small percentage of road networks, low income countries have limited economic growth potential.

A reliable road network is vital to any country, and is especially important for low income countries, because a strong road network can lead to massive economic development benefits. Roads help economies grow by linking markets and allowing the flow of goods, people and services.

Available data provided by the WRS 2018 include the total length of road networks (in km) for each country. This total is broken down into smaller subsections that include: motorways, highways (main or national), secondary (or regional), and other roads. The WRS also categorises countries by geographic region and income group. The analysis of the road network data relating to a country's income group highlights a stark contrast in road network percentages:

• High income countries account for 43% of global road networks while low income countries account for only 3% of them.

The pie chart below above shows the total road network distribution by income group for the latest year of available data.

Source: IRF WRS 2018, latest year of available data for countries

The highest income group has the largest percentage of road networks followed by the upper middle income group, the lower middle income group and finally the low income group with the lowest percentage. The lack of funding and resources for new road networks combined with the absence of maintenance for roads that do exist in low income countries have led to infrastructure deficits and little economic growth. These deficits are partially responsible for preventing low income countries from moving into higher income groups. It is also important to look at the road network distribution by geographic region because the geographic regions of the world that are underdeveloped are usually those of low incomes. The pie chart below shows the total road network distribution by geographic regions of the world.

Source: IRF WRS 2018, latest year of available data for countries

The key statistic to take away from this chart is Sub-Saharan Africa’s low percentage of road networks; it is just 6% in stark comparison to representing 17% of global land mass. Poor roads and infrastructure in this region make delivering goods and services a difficult task for businesses and individuals. According to data available, annual public spending on infrastructure was only 2% of GDP in 2009–15. Sub-Saharan Africa needs to invest billions of US dollars into its infrastructure. Until Sub-Saharan Africa is able to fund significantly higher road infrastructure construction and maintenance, the isolation caused by lack of well-developed and well-maintained road networks will continue to pose a key constraint to achieving the 2030 Sustainable Development Goals.


The new WRS 2018 encompass updated data on over 200 countries: Country Profile, Road Networks, Road Traffic, Multimodal Traffic Comparisons, Vehicles in Use, Road Accidents, Vehicles Industry (Production, Imports, Exports and First Registrations), Road Expenditures & Revenues, and Fuel Energy Prices.

For more information on companies in this article

Related Content

  • Global growth in machine rental
    May 20, 2015
    The machine rental sector is undergoing significant expansion worldwide – Dan Gilkes reports. Plant hire, equipment rental, leasing, call it what you will, being able to use a machine when and where you need it, with no further concerns relating to ownership costs, depreciation or sudden repair bills, remains a compelling argument for many contractors. Which is one of the main reasons for the continued growth in popularity of equipment rental across the world. Rental has been big business in the UK, the US
  • World Road Meeting 2017
    April 16, 2018
    The IRF World Road Meeting 2017 was held recently – World Highways’ India correspondent Partha Pratim Basistha reports The 18th World Road Meeting of the International Road Federation took place between 14-17 November 2017 in the North Indian state of Uttar Pradesh at Greater Noida near India’s capital New Delhi. Close to 1500 delegates and visitors across the world - including India - from the road infrastructure fraternity participated at the global event. The Cross Roads meeting, coinciding with an ex
  • Set the ALARM for repairs in England and Wales
    January 10, 2019
    More than 3,900km of roads in England and Wales will need essential maintenance within the next year, according to the annual ALARM survey* Cash-strapped local governments are reporting that the gap between the funds they received and the amount they needed for repairs and maintenance was almost €639 million. This equated to an average shortfall of €3.75 million for every authority. It would take 14 years to get local roads back into a reasonable steady state, but only if adequate funds and resources wer
  • David Barwell suggests six steps for closing the UK funding gap
    January 11, 2019
    Six steps for closing the UK funding gap Plenty of private money is seeking UK investment opportunities. The government and the infrastructure sector in general must make projects more attractive, writes David Barwell* It is widely acknowledged that the UK faces mounting economic, environmental and social problems if the nation's infrastructure fails to meet present and future demands. Government estimates propose that almost €561 billion is required to bridge the infrastructure funding gap. As part o