
Low income countries account for only 3% of global road networks: a constraint for economic growth

An analysis of road network data from IRF World Road Statistics (WRS) reveals the low percentage of road networks in low income countries and underdeveloped regions of the world. These results link poor quality roads and lack of road infrastructure to constrained economic development and growth The IRF World Road Statistics (WRS) includes up-to-date data on the road and transport sector for over 200 countries and covers nine important road topics, one of which is road networks. An analysis of the road
January 15, 2019 Read time: 3 mins
Source: IRF WRS 2018, latest year of available data for countries
An analysis of road network data from IRF World Road Statistics (WRS) reveals the low percentage of road networks in low income countries and underdeveloped regions of the world. These results link poor quality roads and lack of road infrastructure to constrained economic development and growth


The 1201 IRF Geneva World Road Statistics (WRS) includes up-to-date data on the road and transport sector for over 200 countries and covers nine important road topics, one of which is road networks.

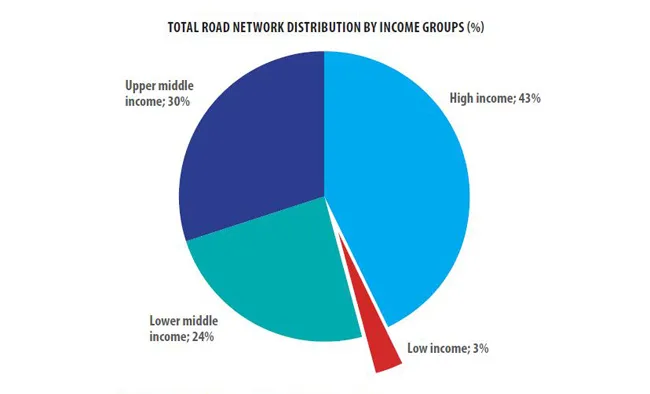
An analysis of the road network data reveals that low income countries account for just 3% of global road networks. With such a small percentage of road networks, low income countries have limited economic growth potential.

A reliable road network is vital to any country, and is especially important for low income countries, because a strong road network can lead to massive economic development benefits. Roads help economies grow by linking markets and allowing the flow of goods, people and services.

Available data provided by the WRS 2018 include the total length of road networks (in km) for each country. This total is broken down into smaller subsections that include: motorways, highways (main or national), secondary (or regional), and other roads. The WRS also categorises countries by geographic region and income group. The analysis of the road network data relating to a country's income group highlights a stark contrast in road network percentages:

• High income countries account for 43% of global road networks while low income countries account for only 3% of them.

The pie chart below above shows the total road network distribution by income group for the latest year of available data.

Source: IRF WRS 2018, latest year of available data for countries

The highest income group has the largest percentage of road networks followed by the upper middle income group, the lower middle income group and finally the low income group with the lowest percentage. The lack of funding and resources for new road networks combined with the absence of maintenance for roads that do exist in low income countries have led to infrastructure deficits and little economic growth. These deficits are partially responsible for preventing low income countries from moving into higher income groups. It is also important to look at the road network distribution by geographic region because the geographic regions of the world that are underdeveloped are usually those of low incomes. The pie chart below shows the total road network distribution by geographic regions of the world.

Source: IRF WRS 2018, latest year of available data for countries

The key statistic to take away from this chart is Sub-Saharan Africa’s low percentage of road networks; it is just 6% in stark comparison to representing 17% of global land mass. Poor roads and infrastructure in this region make delivering goods and services a difficult task for businesses and individuals. According to data available, annual public spending on infrastructure was only 2% of GDP in 2009–15. Sub-Saharan Africa needs to invest billions of US dollars into its infrastructure. Until Sub-Saharan Africa is able to fund significantly higher road infrastructure construction and maintenance, the isolation caused by lack of well-developed and well-maintained road networks will continue to pose a key constraint to achieving the 2030 Sustainable Development Goals.


The new WRS 2018 encompass updated data on over 200 countries: Country Profile, Road Networks, Road Traffic, Multimodal Traffic Comparisons, Vehicles in Use, Road Accidents, Vehicles Industry (Production, Imports, Exports and First Registrations), Road Expenditures & Revenues, and Fuel Energy Prices.

For more information on companies in this article

Related Content

  • Thirst for Infrastructure: The Belt & Road Initiative
    November 8, 2017
    Susanna Zammataro, IRF Geneva, writes: The China Highway and Transportation Society (CHTS) – an esteemed member of IRF – will be hosting a special Session on the Belt and Road Initiative during the IRF World Meeting in Delhi, 14th-17th November 2017. Last May, president Xi Jinping welcomed 28 heads of state and government to Beijing to celebrate the “Belt and Road” initiative, an ambitious plan in terms of infrastructure development, but also in terms of foreign policy. Launched in 2013 as “One belt, On
  • Challenges and investment opportunities in East Africa transport infrastructure Sector
    November 21, 2014
    East Africa offers considerable potential for transport infrastructure expansion and investment - Shem Oirere reports Infrastructure, infrastructure and more infrastructure is what is needed to make East Africa the favoured destination and Kenya, Tanzania, Uganda and Rwanda have unveiled grand plans to enhance the infrastructure both nationally and regionally.” This is how market analyst Deloitte introduced its 2014/15 budget analysis for the four countries in July.
  • INTERMAT organisers see strong growth in construction
    December 12, 2017
    The organisers of the upcoming INTERMAT trade show for construction and infrastructure see strong growth for the sector. The INTERMAT organisers have unveiled the first Construction Industry Observatory report, which was produced in association with French government agency, Business France. The report provides construction-equipment manufacturers with strategic data on 12 countries in the EMEA zone. These nations have been selected for their planned investment levels in infrastructure, which total €1,600
  • Road user charging to pay for road improvements?
    February 20, 2012
    What is the current situation with Russian roads? It is an objective answer to this question that is contained in the official report of the Federal State Statistics Service for 2009. Here it states: "...public roads are of poor quality: 8.4% of roads accounted for groundwater, nearly a third of roads are gravel, rubble or cobblestone.