Improvements in the UK’s road safety levels have stalled.
Safety improvements on the UK’s road network have been stalled since 2012 according to the latest statistics. There were 1,752 reported road deaths in 2019, which is similar to the level that has been seen since 2012.
There was a period of substantial reduction in the UK’s road fatalities from 2006 to 2010 however. And it is worth noting the overall drop in road casualties from a horrific 6,352 in 1979 to around 3,500 in 2003, 2,222 in 2009 and the 1,752 for 2019.
There were 25,945 serious injuries in road traffic crashes reported to the police in 2019, and a total of 153,158 casualties of all severities reported in 2019. This is 5% lower than in 2018 and is the lowest level since 1979 when this statistical series with current definitions and detail began.
Accounting for change in traffic, the rate of fatalities/billion vehicle miles has fallen by 4% from 5.06 in 2018 to 4.87 fatalities/billion vehicle miles in 2019.
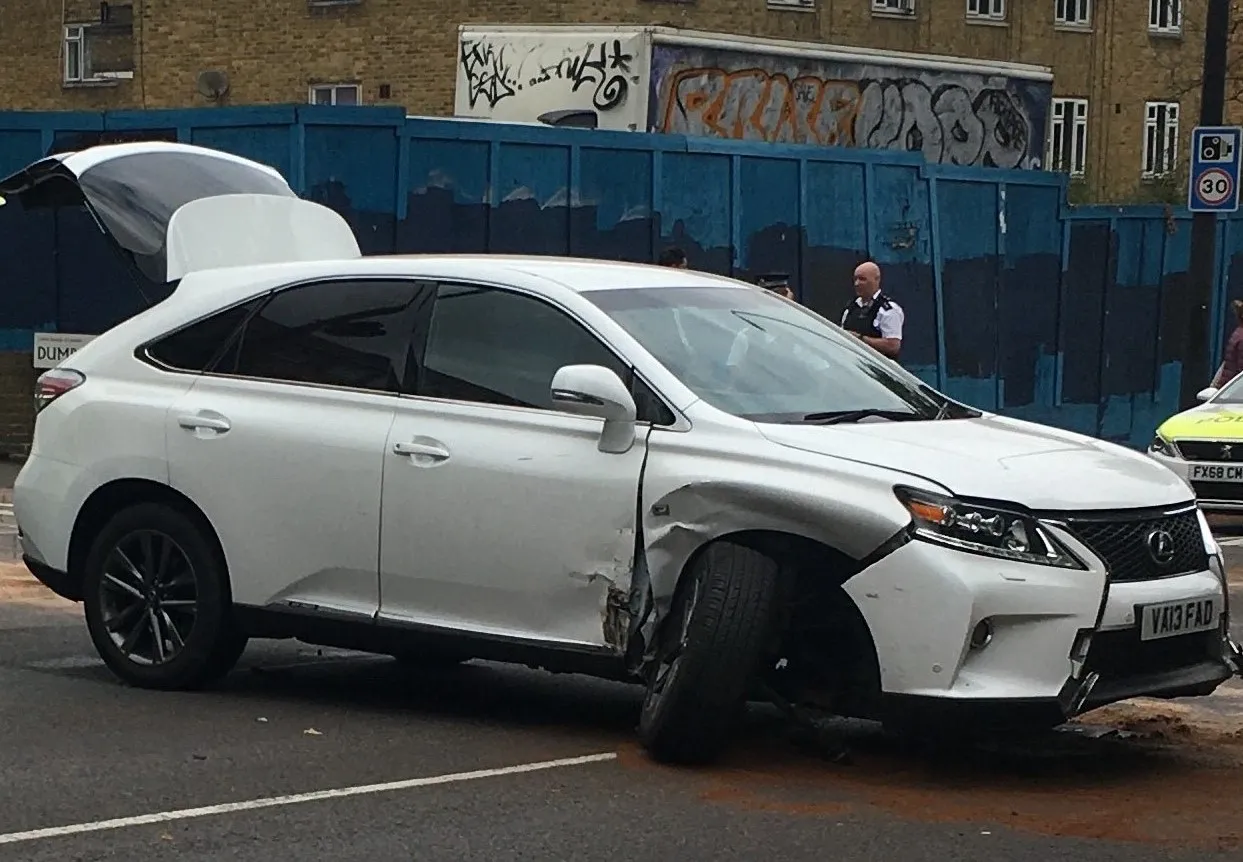
Car occupants continue to account for the largest proportion of casualties of all severities. A total of 736 car occupants were killed in 2019, down 5% (or 41 fatalities) from 777 in 2018. Even though cars account for the most traffic on Great Britain roads (around 80%), the car occupant fatality rate per billion passenger miles travelled was 1.6 in 2019. The majority of car occupant fatalities were car drivers, with 508 car drivers killed and 228 car passengers killed in 2019. Car occupants represents 42% of all fatalities in reported road accidents in 2019. Overall, car occupant casualties decreased by 5% to 89,331 in 2019 compared to 2018, and was the lowest on record representing 58% of all casualties in reported road accidents in 2019.
The number of pedal cyclists killed or seriously injured in Great Britain has increased by 8% between 2009 (4,098) to 2019 (4,433) (using the series adjusted for changes in severity reporting). This is partly explained by an increase in pedal cyclist traffic in Great Britain of 16% from 2009 to 2019 (3.0 to 3.5 billion vehicle miles). Overall pedal cyclist casualties decreased by 4% between 2018 and 2019.
Motorcyclist fatalities decreased in 2019 compared to 2018. In total, 336 motorcyclists were killed during 2019, down 5% from 354 in 2018. However, motorcyclist fatalities have fluctuated between 319 and 365 over 2011 to 2019 with no clear trend. Overall motorcyclist casualties decreased by 4% between 2018 and 2019 to 16,224 casualties. Motorcyclist traffic has been stable in the last 10 years.
Young car drivers aged 17-24 and car passengers are more likely to be injured in a road crash than older car drivers and passengers, however, car drivers aged 80+ are substantially more likely to be injured in a car accident than car drivers aged 50-74. The casualty rate/billion miles travelled for car passengers aged 17-24 is twice the rate for car passengers aged 85+. There were 287 people killed from accidents involving a young car driver in 2019, a decrease of 7% from the previous year. There were 444 people killed from crashes involving an older car driver in 2019, an increase of 9% from the previous year.