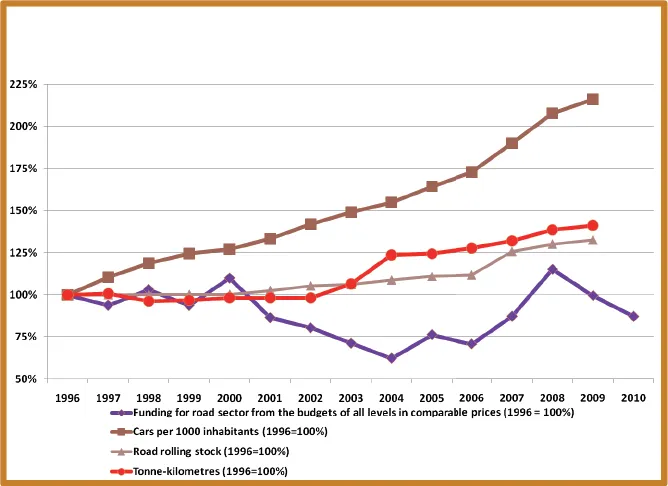
Data from the UK’s Department for Transport (DfT) shows that motor vehicle traffic has increased, for the tenth quarter in succession. Motor vehicle traffic in Great Britain increased by 2.2% in the year ending September 2015 from the previous year. The provisional figure of 505.76 billion vehicle km is the highest rolling annual total ever and 0.6% higher than the pre-recessional peak in the year ending September 2007.
The upward trend in traffic volumes is likely to reflect growth in the UK economy, wi
Data from the UK’s 5432 Department for Transport (DfT) shows that motor vehicle traffic has increased, for the tenth quarter in succession. Motor vehicle traffic in Great Britain increased by 2.2% in the year ending September 2015 from the previous year. The provisional figure of 505.76 billion vehicle km is the highest rolling annual total ever and 0.6% higher than the pre-recessional peak in the year ending September 2007.
The upward trend in traffic volumes is likely to reflect growth in the UK economy, with GDP 2.6% higher in the year ending September 2015 than in the previous year. Lower fuel prices may also have contributed to increased traffic.
Compared to the previous year, in the year ending September 2015, car traffic increased by 1.7% and van traffic continued to rise faster than any other vehicle type, up 6% to a new peak of 75.04 billion vehicle km. In addition, all road classes experienced higher volumes of traffic, with traffic on rural minor roads increasing the fastest, at 5.8%. Motorway traffic increased by 2% to 105.64 billion vehicle km, the highest ever level.
Car and taxi traffic increased by 1.7% on the previous year to 396.16 billion vehicle km. This is just below the peak level of 397.28 billion vehicle km in the year ending June 2007. LGV traffic increased by 6% from the previous year to a new high of 75.04 billion vehicle km. LGV traffic has increased its share of motor vehicle traffic by 2.4% from10 years ago, from 12.4% in the year ending September 2005 to 14.8% in the year ending September 2015. HGV traffic increased on the previous year by 1.2%, but remains below the peak level in the year ending June 2008.
Traffic has increased across all road types and on motorways and rural roads was higher than it has ever been. Motorway traffic increased by 2% from the previous year, to 104.64 billion vehicle km. Traffic on urban roads increased by 1.0% on the previous year but remains 4% below the peak level of 191.424 billion vehicle km in the year ending September 2007.
On rural A roads traffic rose by 2% to 145.12 billion vehicle km, while on urban A roads traffic rose by 0.5% to 79.04 billion vehicle km. Traffic volumes also increased by 5.8% on minor rural roads, the biggest percentage increase of any road type, to 72.64 billion vehicle km. On minor urban roads traffic grew by 1.4% to 104.32 billion vehicle km.