The latest data from France shows an increase in cycling for mobility. There has been a 5% growth in bicycle use in France, according to a report by the association, Vélos & Territoires. Both conventional bicycles and e-bikes figure in this increase in cycling according to the data. The utilisation of bicycles increased 7% during the week and by 6% in urban use compared to 2022. New cycle lanes in Paris as well as restrictions on the use of private cars have further helped increase levels of cycling in France’s capital.
And according to data from Transport for London (TfL) cycling in the city shows a 20% increase in cycling in 2023 compared to 2019. The Travel in London report shows a growth in cycling, following on from the rise during the COVID-19 pandemic. TfL says that while overall cycling numbers have climbed, there have been changes in the characteristics of these journeys. The average length of cycling trips has decreased, indicating a shift towards shorter, more localised travel. In addition, there is a higher proportion of off-peak travel compared to before the pandemic .
In Italy meanwhile, further boosts for cycling are expected with the development of the Apulian aqueduct, which will see a total 192km of cycle routes. The project is being managed by AQP, with financing of €35 million being provided by regional funds and NRRP funds. The new sections will deliver a cycle path on an aqueduct, forming part of the National Cycling Route No 11.
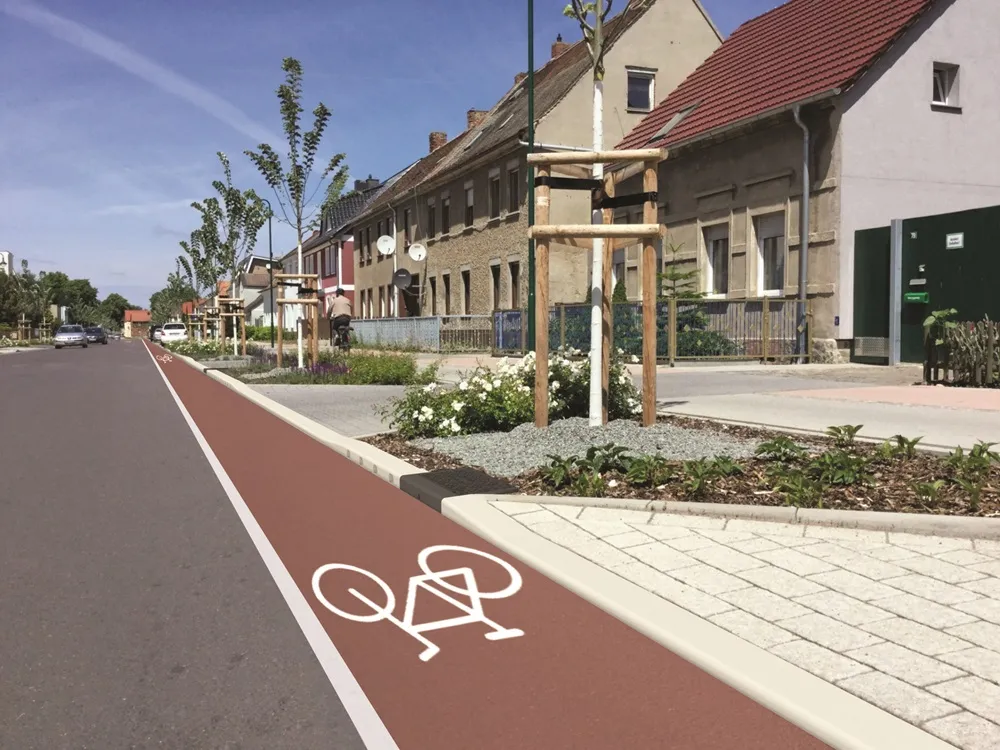
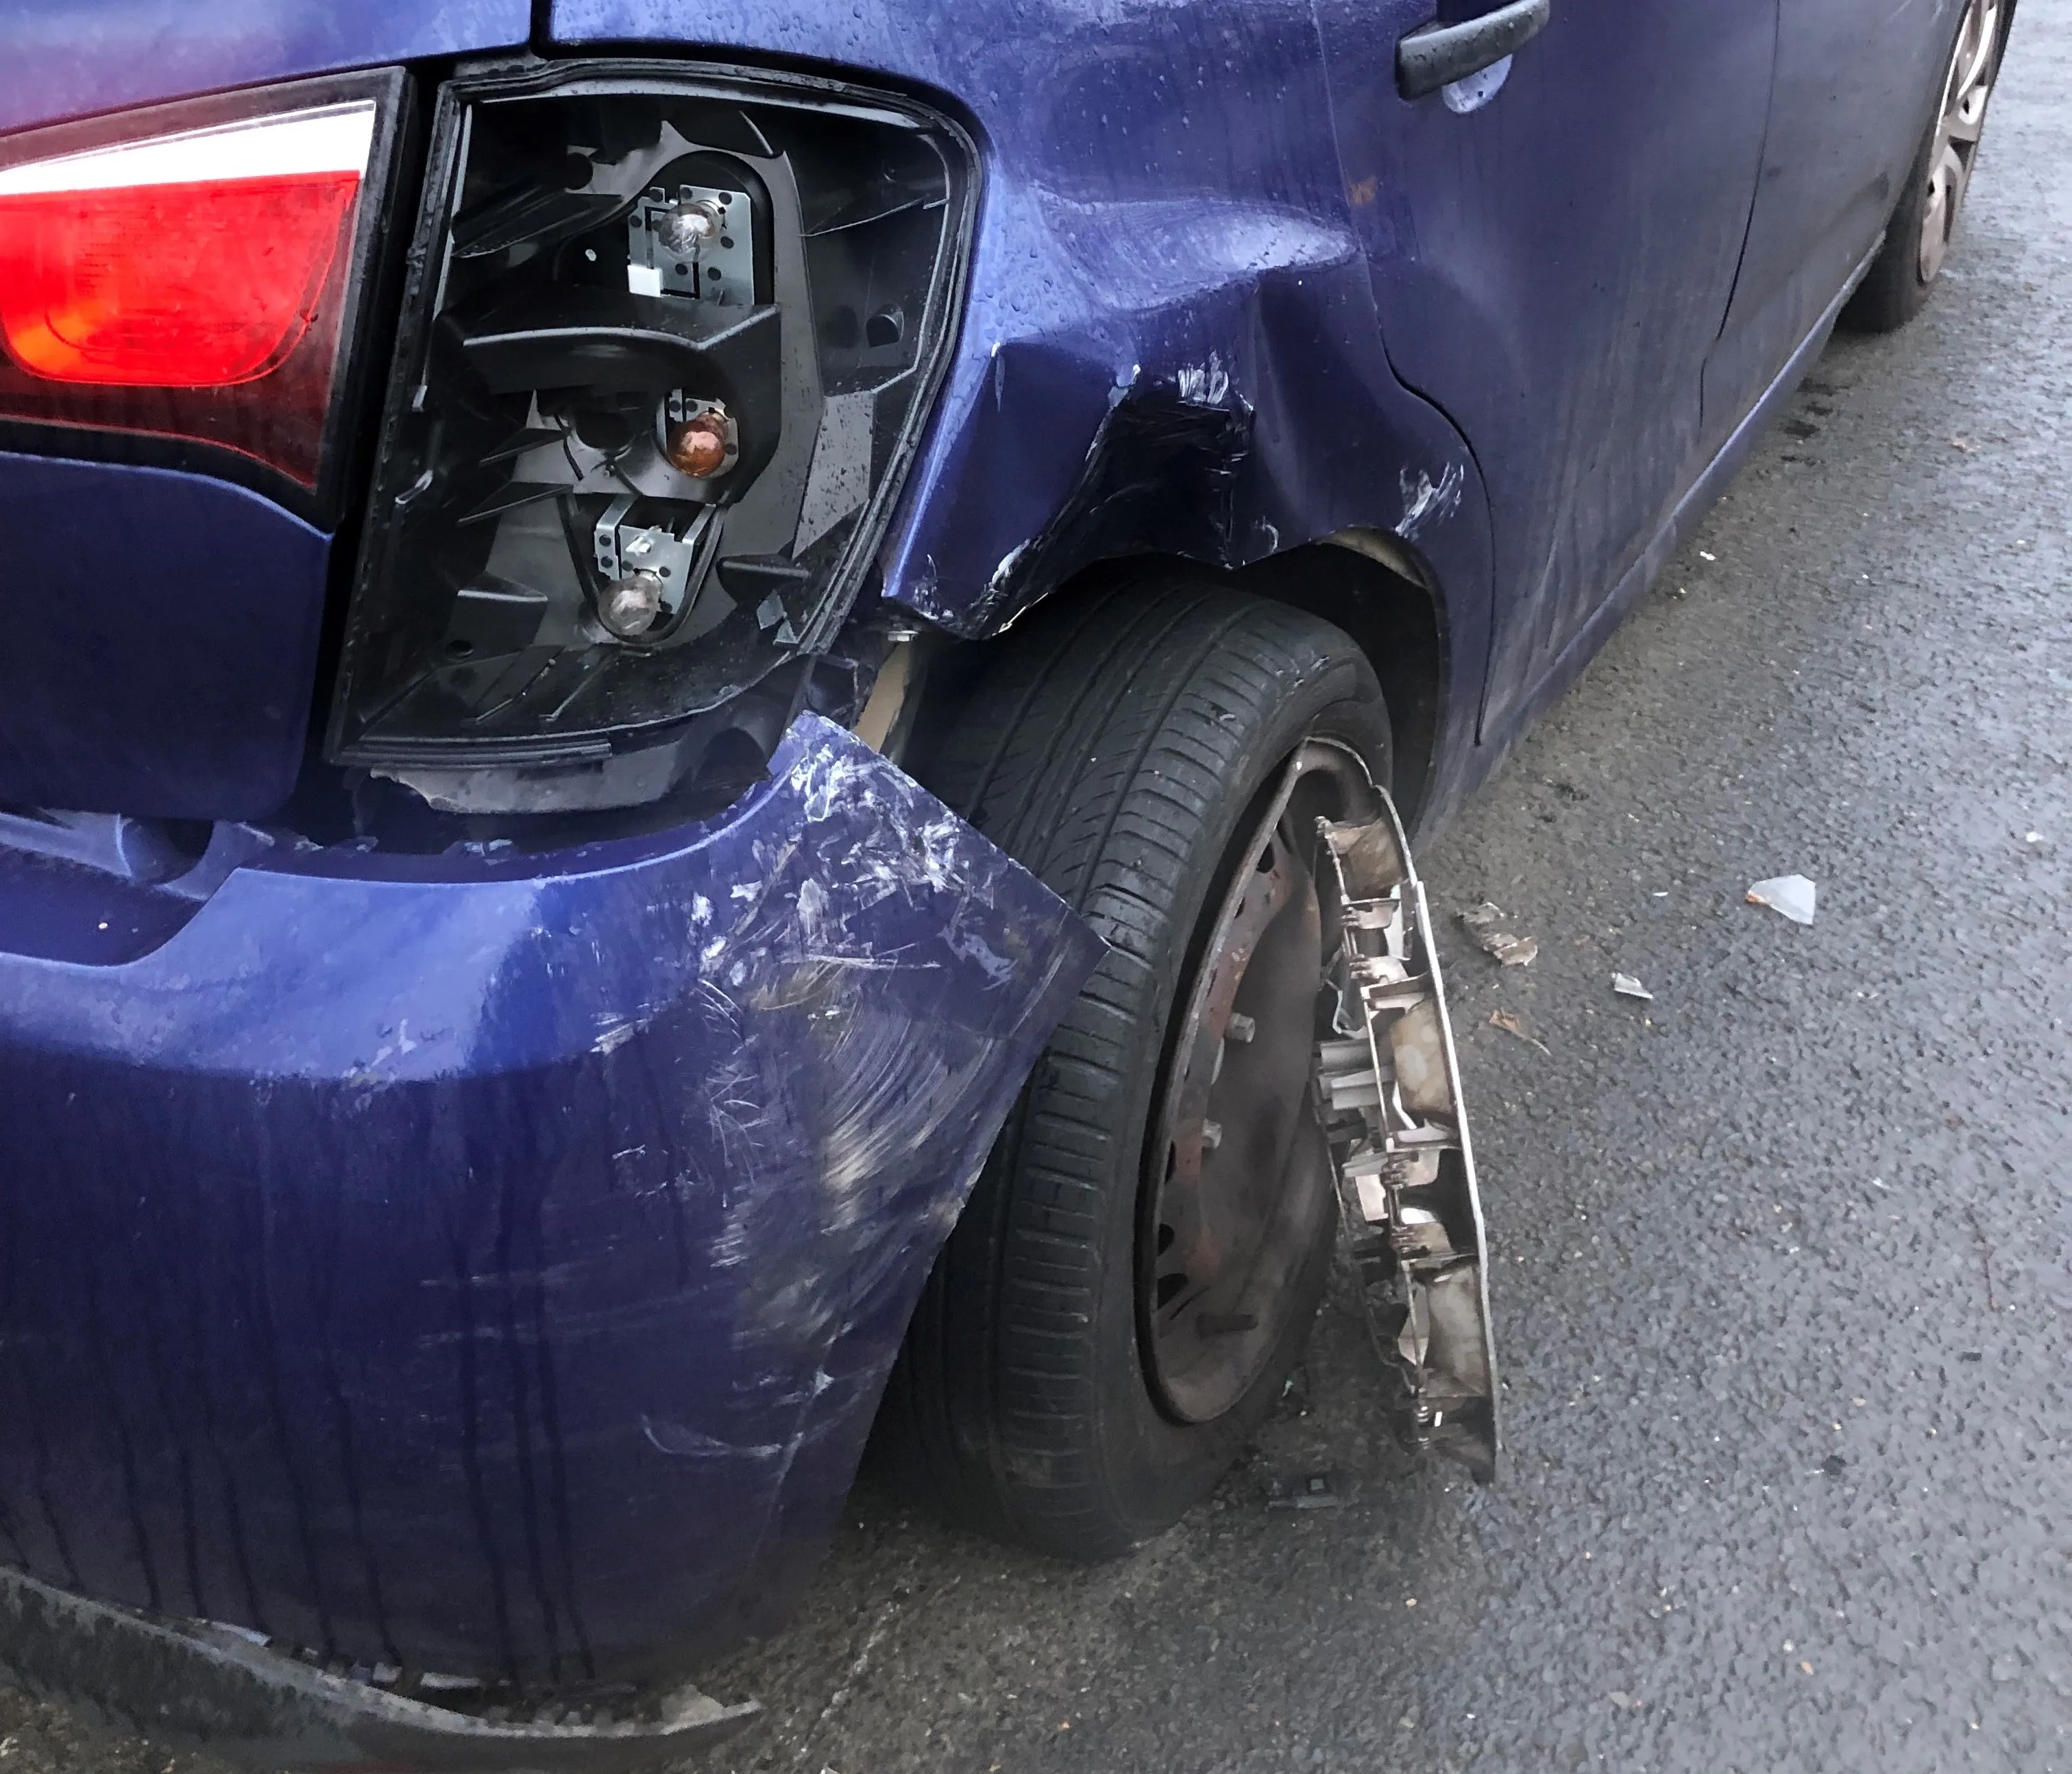
The growth in cycling will help in the reduction of transport emissions, particularly in large cities such as Paris and London. This will also help to boost public health and boost productivity. Amsterdam and Copenhagen have set the lead in encouraging cycling in urban Europe but are now being followed by other cities. However, questions remain over the safety of cyclists due to poor standards of driving. And the layout of many cycling facilities is also in question, with too many routes not meeting safety standards and clearly not having been designed by people who actually ride bicycles.