The whole premise of bike lanes is that giving cyclists a dedicated space will allow them to ride safely and coexist with vehicle traffic. And yet, bike lanes don’t always make cyclists safer - and sometimes they offer no protections at all.
New York City, for example, has reported 34,112 collisions between cyclists and motorists since 2014, despite the addition or enhancement of about 330mls of bike lanes. There were 27 cyclists killed in 2019, the most in any year since 2000.
As COVID-19 inspires more people to use bicycles. it seems likely that accidents—and fatalities - willl rise. We need to examine whether the bike lane improvements that cities are investing in actually make roads safer for cyclists. And if they are not safer, why not? How can cities then design them to be safer?
Smart Design analysed bike lanes using open data sets from three major US cities: New York, Boston and San Francisco. We looked at each city’s number of collisions before and after bike lanes were installed. The numbers were adjusted to account for the overall increase in ridership which, of course, would make the number of collisions go up.
We also wanted to know if bike lane design was a factor in the increased number of collisions.
The study identified three main types of bike lane improvement:
- conventional lanes designated with painted white lines;
- protected bike lanes separated from car lanes by a physical buffer;
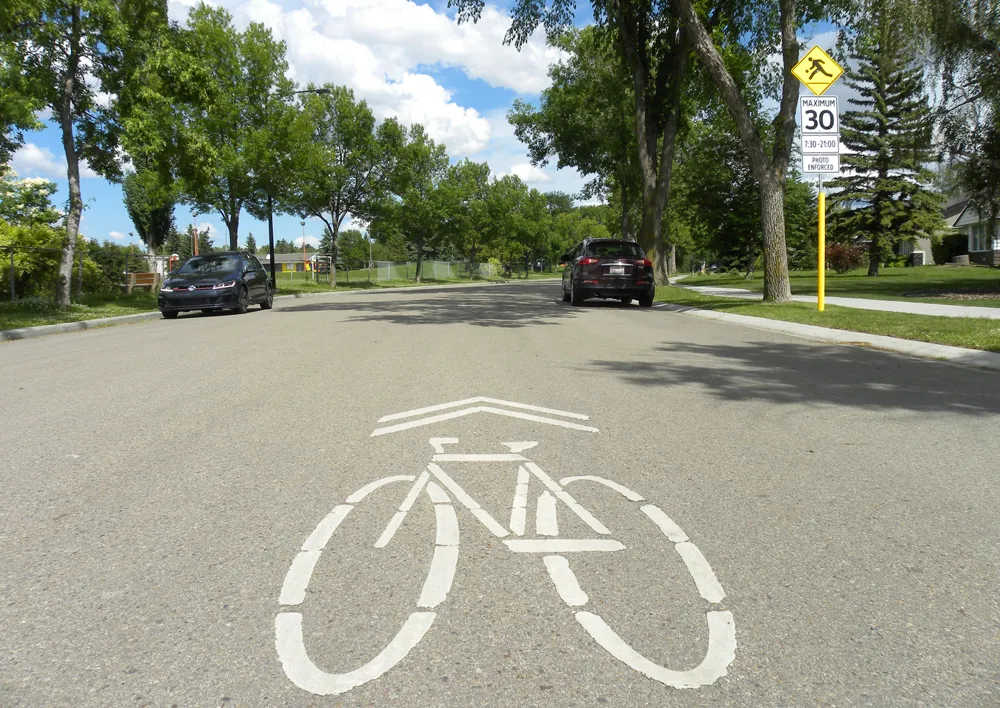
- painted whole lanes - usually green - with icons called sharrows (see box) to indicate where cars and bikes share the lane.
We looked at whether collisions occurred in intersections or on streets. Collision data since 2012 was combined with bike lane improvements over the same period.
Physical barriers
As expected, bike lanes protected by physical barriers resulted in a decrease in collisions over time. Meanwhile, the most common improvements - conventional painted lanes - did little to affect collisions.
Collisions in San Francisco decreased a fair amount after bike lane improvements. But New York City’s bike lanes experienced a marked increase in collisions over time, especially in its sharrow lanes.
While all three cities saw most of their collisions occur around intersections, Boston’s intersections suddenly saw a dramatic decrease in collisions after 2015. Why was this happening in Boston?
According to quantitative data, collisions had increased along New York City’s sharrow roads. Using Google Streetview, we saw that New York City had painted the sharrow icon on the side of the lane where only cyclists would see it, not motorists.
Meanwhile, Boston had painted the sharrow icon in the centre of the road. In other words, where design was geared toward motorists, collisions went down and where design was geared toward cyclists, collisions increased.
Boston had also developed a design system for its intersections called bike boxes (see box) with areas painted a vivid green and marked with icons to show where cyclists could make turns or wait for the light to change. This was a pretty compelling explanation for why collisions in Boston’s intersections dropped.
Lastly, we studied some of New York City’s most problematic intersections to see if there might be a design explanation. Google Streetview has a feature that captures an intersection over a period time, which we correlated to rises and falls in its numbers of collisions.
We often saw intersections that had been repaved and then the bike lanes were only partially repainted - or not repainted at all. It seemed that New York was not considering bike infrastructure when creating construction plans. This meant confusing or absent markings at intersections which resulted in more collisions.
More and better data
While collision data for intersections in Boston and San Francisco was straightforward, New York City proved difficult. Where the other two cities specified intersection versus street in their collision reporting, New York only gave longitude and latitude of each crash.
But using an algorithm method called R-tree we could draw a bubble around each route. A collision within that bubble could be assigned to a corresponding bike route. This gave a more comprehensive picture of what was happening on the street. But it was also a reminder that solid, reliable data depends on cities collecting as many pertinent details as possible regarding these collisions.
As to the question whether bike lanes make cyclists safer, it depends upon the design. This study concludes that three simple design imperatives could reduce collisions.
One imperative is to repaint sharrows in the middle of the road, not on the side, so motorists, too, see them. Another design is to prioritise cyclists with dedicated, clear markings through intersections. The third imperative is to always update bike lane markings in intersections after construction.
Safety measures don’t have to be a guessing game. By collecting good, detailed data, cities can empower more studies like ours and come up with actionable, effective solutions that better protect people.
Bike Boxes
According to NATCO, the US National Association of City Transportation Officials: “A bike box is a designated area at the head of a traffic lane at a signalised intersection that provides bicyclists with a safe and visible way to get ahead of queuing traffic during the red signal phase.”
NACTO is an association of 81 major North American cities and transit agencies formed to exchange transportation ideas, insights and practices concerning national transportation issues. The association has published the NACTO Urban Bikeway Design Guide as part of its Cities for Cycling initiative – a forum for safer cycling practices and pathway design.
Sharrows
A shared-lane marking – commonly called a sharrow - is a street marking in a vehicle lane to indicate where people should preferably cycle. Sharrows are commonly found in New Zealand, Australia, Canada, Spain and the US.
The US Manual on Uniform Traffic Control Devices says shared-lane markings may be used to:
- Assist cyclists with lateral positioning in a shared lane with on-street parallel parking in order to reduce the chance of a cyclist impacting the open door of a parked vehicle;
- Assist cyclists with lateral positioning in lanes that are too narrow for a motor vehicle and a bicycle to travel side by side within the same traffic lane;
- Alert motorists of the lateral location that cyclists are likely to occupy within the travelled way;
- Encourage safe passing of cyclists by motorists; and
- Reduce the incidence of wrong-way cycling.
The American Association of State Highway Transportation Officials – AASHTO –is updating its Guide for the Development of Bicycle Facilities for publication this year. The work is being done in conjunction with design agency Toole Design, which has been involved in preparing various editions of the guide since the 1990s. The latest update incorporate bikeway designs for people of all ages and abilities.