INRIX, a global developer of car services and movement analytics, has launched INRIX Roadway Analytics, a set of on-demand tools to be available in Europe and the Middle East this autumn. It enables instant analysis of INRIX XD Traffic information via the cloud.
The cost of infrastructure congestion is estimated at 1% of GDP across Europe. At the same time, research suggests that up to US$400 billion could be saved globally each year as a result of improving existing infrastructure through better managem

INRIX, a global developer of car services and movement analytics, has launched INRIX Roadway Analytics, a set of on-demand tools to be available in Europe and the Middle East this autumn. It enables instant analysis of INRIX XD Traffic information via the cloud.
The cost of infrastructure congestion is estimated at 1% of GDP across Europe. At the same time, research suggests that up to US$400 billion could be saved globally each year as a result of improving existing infrastructure through better management and maintenance.
These factors highlight the importance of equipping road agencies with the latest tools to ensure they have the necessary insight to make informed decisions. "By 2030, 60% of the world's population will live in urban areas. We know from our public sector customers that there is a growing need for tools that identify trends when planning, monitoring, assessing and communicating the performance of roadways,” says Scott Sedlik, general manager for the public sector at5367 INRIX.
INRIX Roadway Analytics leverages the world's largest traffic data network that covers eight million kilometres of road in 45 countries. Technical analyses, charts, tables and other visualisations that form the output of the service are founded on reliable, tested data – the same data that leading automakers and transport agencies around the world rely on today.
INRIX Roadway Analytics allows users to create reports and other communication materials to convey important information and recommendations to drivers, decision makers and the general public. Roadway Analytics includes Data Downloader that enables users to directly query INRIX XD Traffic speed archive data for any road segment and/or time period required. Performance charts produce line and bar graphs that enable, which enable before and after studies and/or comparison studies of roadways and use visualisations to communicate findings.
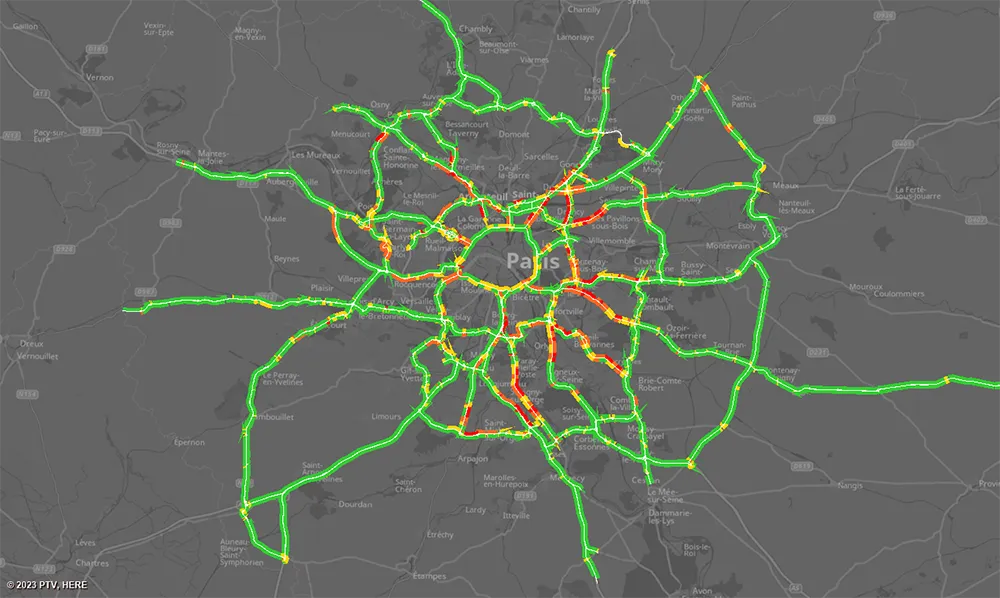
Congestion Scan uses heat maps to identify problem areas along a road, meaning transport agencies can pinpoint the location of congestion to better target improvement efforts. Meanwhile, Bottleneck Ranking identifies all bottlenecks or congested corridors during a specific analysis period within an area, and provides a ranking by determining the number of occurrences, length and duration of each bottleneck.
National agencies benefit from access to on-demand data to analyse, visualise and understand road performance without the need for additional technology investments. They can also identify and compare locations that are operating sub-optimally to help prioritise road improvements and the investment of time and money, as well as perform before and after studies to quantify and communicate the impact of a road improvement or traffic event.
For cities, INRIX Roadway Analytics allows agencies to perform before and after studies to quantify and communicate the impact of a road improvement or event. They can monitor and identify performance trends on key roads, corridors or segments daily, monthly or yearly.
Key performance indicators (KPIs) reports can be outlined for travel times, congestion reduction and other areas, such as emergency response times. They can also regularly monitor and compare roadway conditions at roadwork and construction sites and make adjustments to minimise the impact on traffic flow.
The cost of infrastructure congestion is estimated at 1% of GDP across Europe. At the same time, research suggests that up to US$400 billion could be saved globally each year as a result of improving existing infrastructure through better management and maintenance.
These factors highlight the importance of equipping road agencies with the latest tools to ensure they have the necessary insight to make informed decisions. "By 2030, 60% of the world's population will live in urban areas. We know from our public sector customers that there is a growing need for tools that identify trends when planning, monitoring, assessing and communicating the performance of roadways,” says Scott Sedlik, general manager for the public sector at
INRIX Roadway Analytics leverages the world's largest traffic data network that covers eight million kilometres of road in 45 countries. Technical analyses, charts, tables and other visualisations that form the output of the service are founded on reliable, tested data – the same data that leading automakers and transport agencies around the world rely on today.
INRIX Roadway Analytics allows users to create reports and other communication materials to convey important information and recommendations to drivers, decision makers and the general public. Roadway Analytics includes Data Downloader that enables users to directly query INRIX XD Traffic speed archive data for any road segment and/or time period required. Performance charts produce line and bar graphs that enable, which enable before and after studies and/or comparison studies of roadways and use visualisations to communicate findings.
Congestion Scan uses heat maps to identify problem areas along a road, meaning transport agencies can pinpoint the location of congestion to better target improvement efforts. Meanwhile, Bottleneck Ranking identifies all bottlenecks or congested corridors during a specific analysis period within an area, and provides a ranking by determining the number of occurrences, length and duration of each bottleneck.
National agencies benefit from access to on-demand data to analyse, visualise and understand road performance without the need for additional technology investments. They can also identify and compare locations that are operating sub-optimally to help prioritise road improvements and the investment of time and money, as well as perform before and after studies to quantify and communicate the impact of a road improvement or traffic event.
For cities, INRIX Roadway Analytics allows agencies to perform before and after studies to quantify and communicate the impact of a road improvement or event. They can monitor and identify performance trends on key roads, corridors or segments daily, monthly or yearly.
Key performance indicators (KPIs) reports can be outlined for travel times, congestion reduction and other areas, such as emergency response times. They can also regularly monitor and compare roadway conditions at roadwork and construction sites and make adjustments to minimise the impact on traffic flow.