There is both good and bad to be seen in the latest data on UK road safety from the Department for Transport (DfT). For the year ending September 2015 there were 23,700 killed or seriously injured (KSI) casualties, a 3% decrease compared with the previous year. However road deaths increased by 3% to 1,780, compared with 1,731 for the year ending September 2014. There were also 188,830 reported road casualties of all severities, 3% lower than for the year ending September 2014. Of note is the fact that motor
February 5, 2016
Read time: 2 mins
RSSThere is both good and bad to be seen in the latest data on UK road safety from the 5432 Department for Transport (DfT). For the year ending September 2015 there were 23,700 killed or seriously injured (KSI) casualties, a 3% decrease compared with the previous year. However road deaths increased by 3% to 1,780, compared with 1,731 for the year ending September 2014. There were also 188,830 reported road casualties of all severities, 3% lower than for the year ending September 2014. Of note is the fact that motor traffic levels rose by 2.2% compared with the 12 month period ending September 2014. Using this data, the overall casualty rate/vehicle mile decreased by 5% for the same period.
Between July and September 2015 there were 450 road deaths, a 2% decrease from the same quarter in 2014. And KSI casualties decreased by 3% with slightly injured casualties and overall total casualties both falling by 1% compared with the same quarter in 2014.
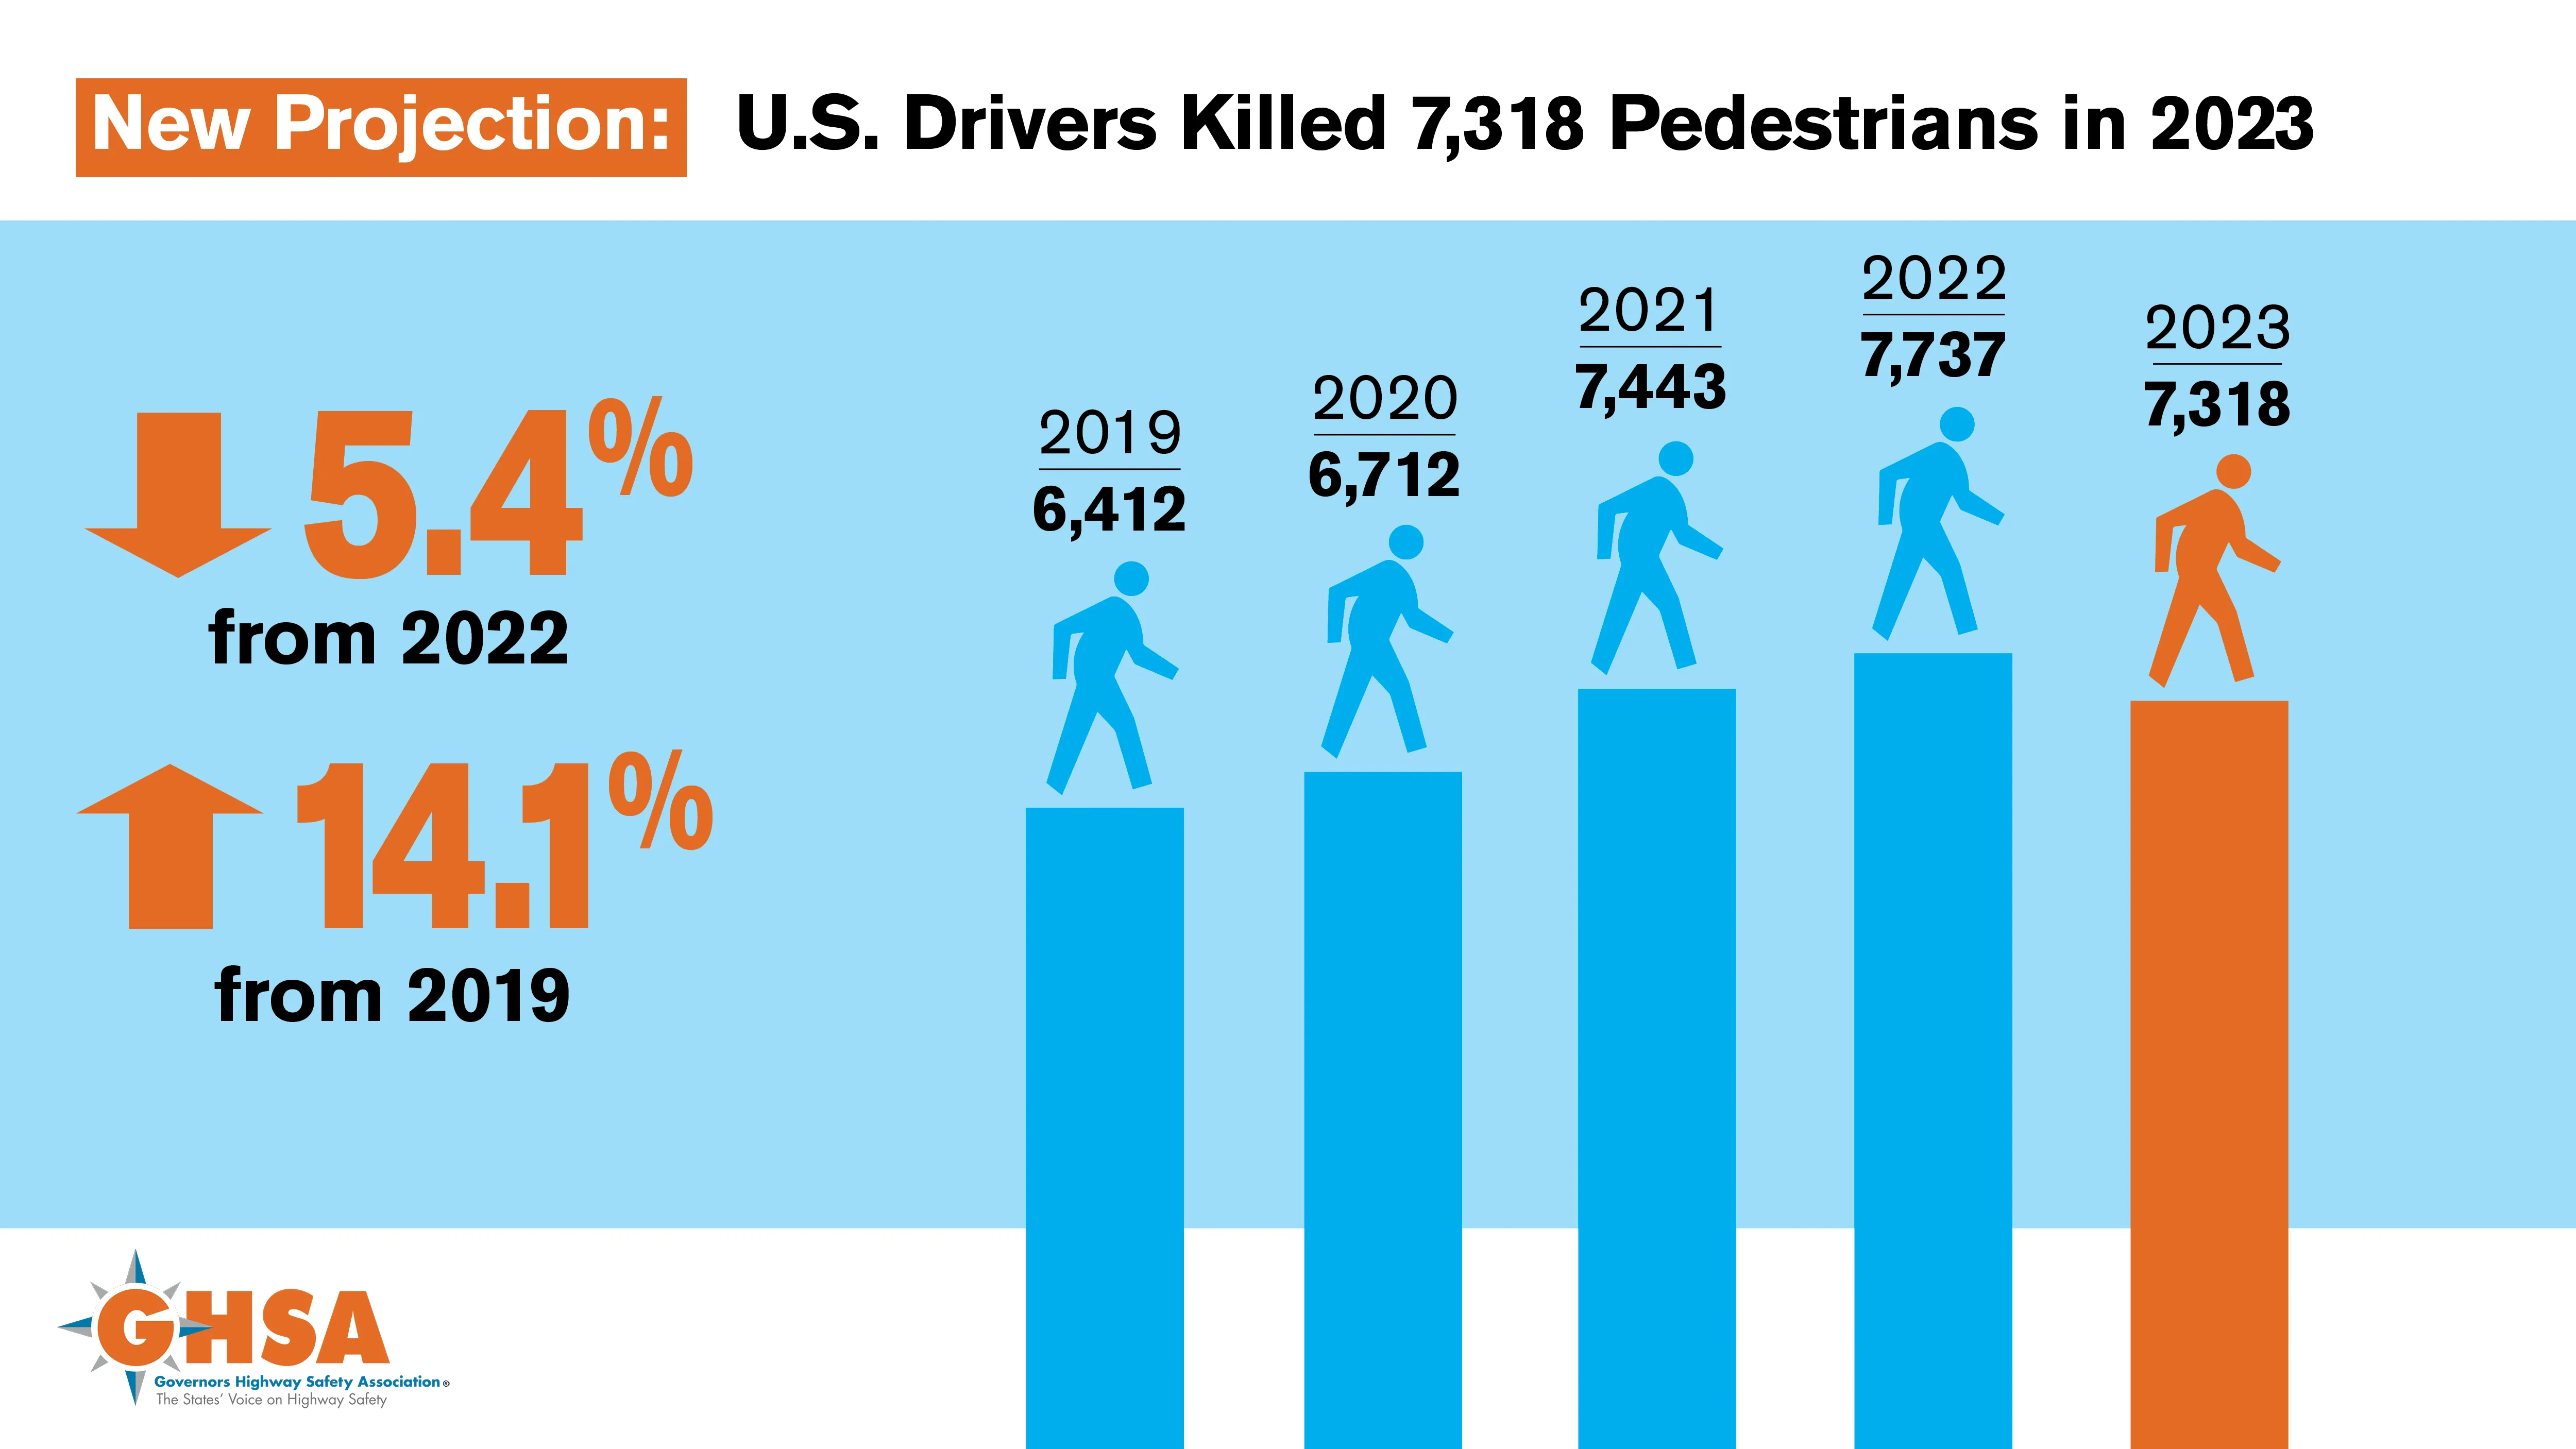
The data for vulnerable road users shows a gain for safety. The KSI figures for the year ending September 2015 cyclists saw a 5% decrease to 3,340, while the KSI figures for pedestrians dropped 4% to 5.300 and the KSI figures for motorcyclists dropped 3% to 5,350. The KSI figures for car occupants also fell 3% to 8,580. Child KSI casualties dropped 8% to 1,900.
Road safety charity3963 Brake says it is disappointed over these figures. An estimated 5,620 drink-drive crashes took place in Great Britain in 2014, equivalent to just over 15 collisions/day. These crashes resulted in 240 deaths and represent 14% of all deaths on the roads; there were 8,220 casualties.
Brake’s campaigns director Gary Rae said, “Behind the statistics, families are ripped apart by what is a violent and sudden death. I want to know what the government intends to do to stop these wholly preventable deaths. It’s time for them to take action: reintroduce casualty reduction targets; reduce the drink drive limit to 20mg per 100ml of blood, and introduce much tougher penalties for criminal drivers.”
Between July and September 2015 there were 450 road deaths, a 2% decrease from the same quarter in 2014. And KSI casualties decreased by 3% with slightly injured casualties and overall total casualties both falling by 1% compared with the same quarter in 2014.
The data for vulnerable road users shows a gain for safety. The KSI figures for the year ending September 2015 cyclists saw a 5% decrease to 3,340, while the KSI figures for pedestrians dropped 4% to 5.300 and the KSI figures for motorcyclists dropped 3% to 5,350. The KSI figures for car occupants also fell 3% to 8,580. Child KSI casualties dropped 8% to 1,900.
Road safety charity
Brake’s campaigns director Gary Rae said, “Behind the statistics, families are ripped apart by what is a violent and sudden death. I want to know what the government intends to do to stop these wholly preventable deaths. It’s time for them to take action: reintroduce casualty reduction targets; reduce the drink drive limit to 20mg per 100ml of blood, and introduce much tougher penalties for criminal drivers.”


