The UK has the second safest road network in the world, beaten only by Sweden according to the latest traffic data analysis from the Department for Transport (DfT). Fatalities from road crashes account for 28.3 deaths/million of population in the UK, compared with 28 fatalities/million of population in Sweden according to the DfT data. It should be noted too that the UK has a larger population and a far higher population density, as well as 35.6 million registered vehicles (an increase of 41% since 1994) an
The UK has the second safest road network in the world, beaten only by Sweden according to the latest traffic data analysis from the 5432 Department for Transport (DfT). Fatalities from road crashes account for 28.3 deaths/million of population in the UK, compared with 28 fatalities/million of population in Sweden according to the DfT data. It should be noted too that the UK has a larger population and a far higher population density, as well as 35.6 million registered vehicles (an increase of 41% since 1994) and considerably more vehicles/km of road than Sweden.
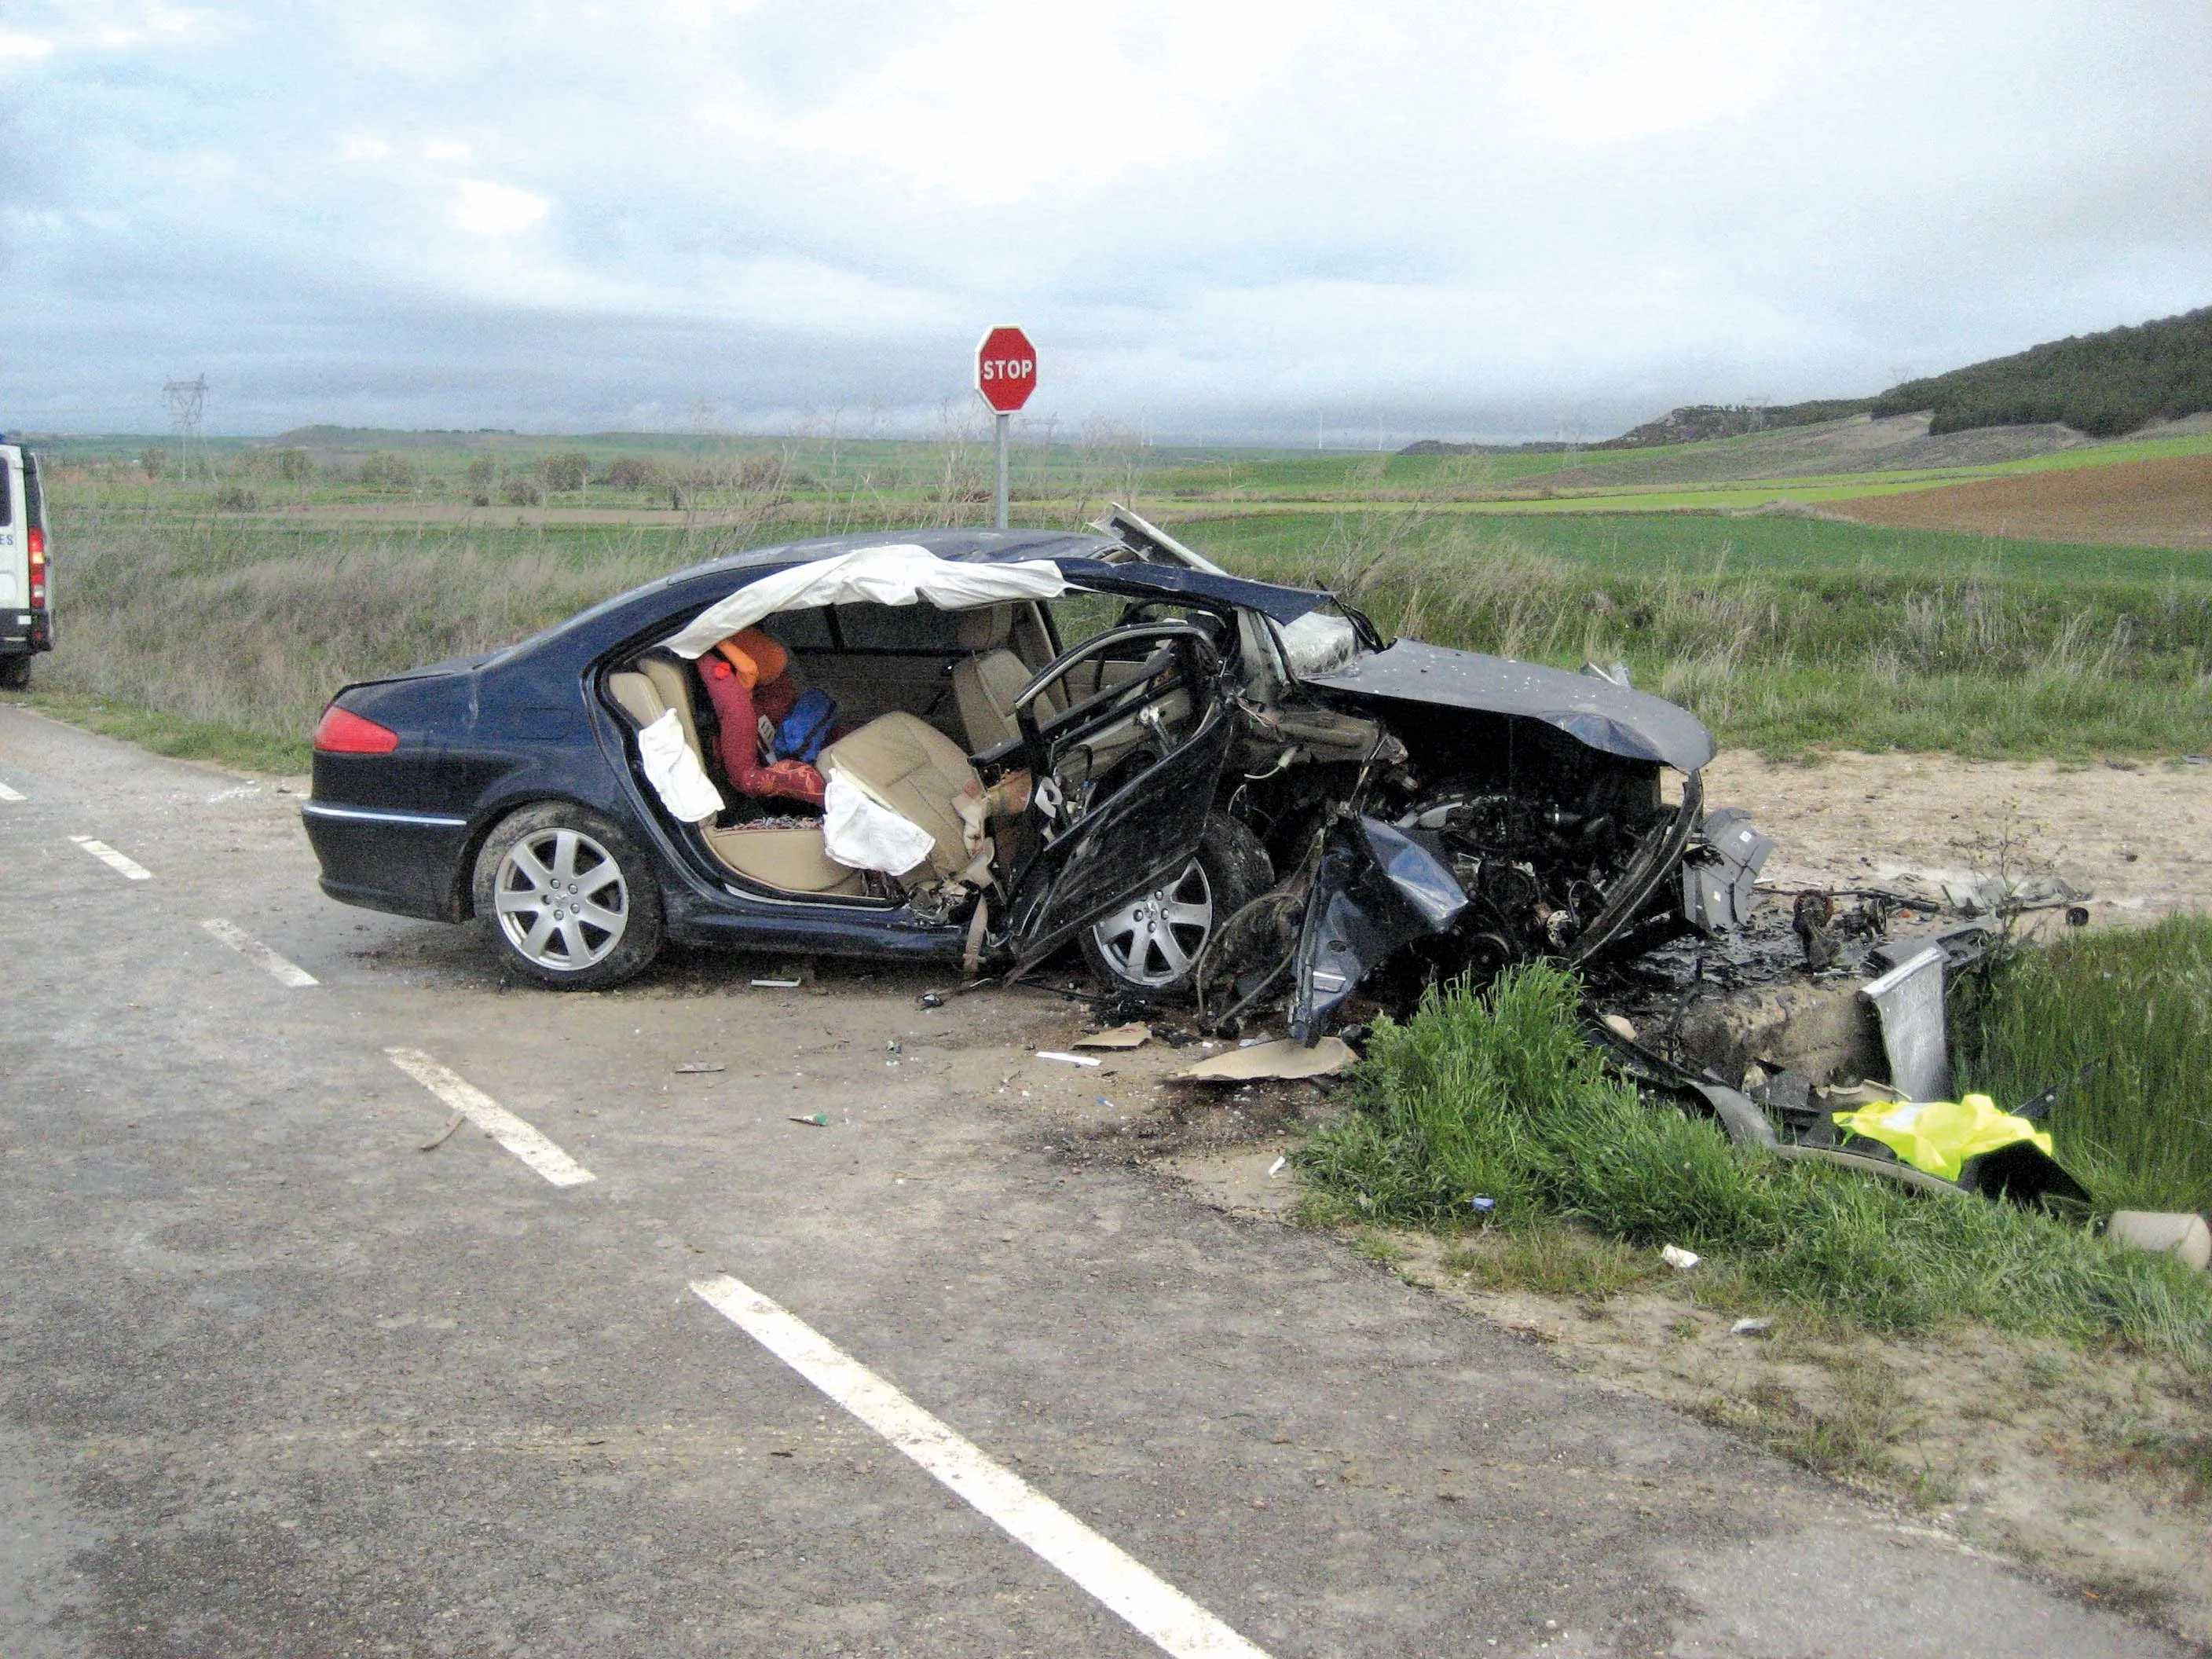
Rural roads were again the most dangerous in the UK in 2014, accounting for 1,063 fatalities. Meanwhile there were 616 deaths on urban roads and just 96 on motorways. Of those killed, 45% were in cars, 25% were pedestrians, 19% were motorcyclists and 6% were cyclists.
On urban roads 46% of casualties were pedestrians and 26% vehicle occupants, with 16% being motorcyclists and 8% being cyclists. On rural roads 54% of casualties were for vehicle occupants, 13% pedestrians, 22% motorcyclists and 8% cyclists. On motorways, 60% of casualties were vehicle occupants and 5% were motorcyclists but alarmingly, 22% were pedestrians (even though pedestrians are not allowed in the immediate vicinity of motorways).
In all UK residents travelled an average of 10,400km/year, a total of 788 billion passenger km/year, down from the peak of 792 billion passenger km/year of 2007. Of those journeys, 64% in England were by car and accounted for 78% of the total distance travelled. London residents have the longest average commute to and from work at 45 minutes, with 68% travelling to work using a car or van. There was an increase in total distance travelled by motor vehicles to 497.6 billion km, up 2.4% for 2014 compared with 2013.
Cars account for 83% of the 35.6 million registered in the UK, with vans accounting for 9.7%, motorcycles for 3.4%, HGVs for 2% and buses/coaches 1.3%.
The UK’s air is also improving with a halving of airborne pollutants from transport since 1990, apart from for particulate matter associated with diesel engines. Sulphur dioxide emissions from transport have dropped 91% from 1990-2013, with the introduction of low sulphur fuels. Emissions of lead from transport have fallen to just 3% of the levels seen in 1990. From 2000-2014, average fuel consumption for petrol cars has fallen 31% and 25% for diesel cars.