Data allowing safety on UK motorways

Accurate data is allowing safer roads for UK motorways
By Adam Hill February 17, 2025 Read time: 2 mins
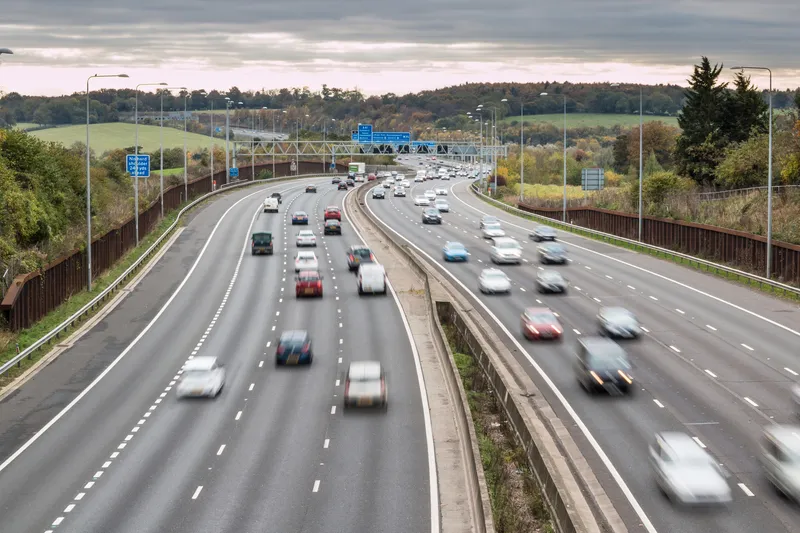
Data can improve safety on UK motorways – image courtesy of © Gorgios| Dreamstime.com


Connected vehicle (CV) data from Compass IoT is being used by Purdue University to visualise travel speeds, traffic flow and bottlenecks on motorways in the UK. The US university has developed speed heatmaps to understand traffic flow, congestion and corridor management.

These maps enable transport agencies, local councils and national highway authorities to better understand speed variations, congestion patterns, and traffic pinch points, supporting data-driven decision-making to improve network performance - including improving incident response.

Purdue speed heatmap using Compass connected vehicle data visualising overnight M5 closures. They also provide insights into when and where closures occur by visually identifying data gaps.

The research has been led by Professor Darcy Bullock, whose expertise is the use of CV data for traffic management. "Applying connected vehicle data to UK motorways allows us to analyse congestion and speed fluctuations with a level of detail that traditional methods simply can’t provide," said Compass general manager Marinos Tsiplakis. 

"Partnering with universities like Purdue enables us to combine real-world vehicle movement data with globally recognised research expertise to help authorities optimise their road networks."

The project leveraged passively-collected vehicle trajectory data for December 2024 to analyse and visualise travel speeds across key UK corridors, including the M4 and M5.

This showed, for example, the effects of motorway closure following a crash on the M4 on 12 December from 4.30am to 8pm: the maximum queue length shown on the heatmap was approximately 5-6km. 

Overnight closures - part of National Highways' resurfacing scheme - on the northbound M5 from 9pm to 6am from Monday to Thursday are shown by white gaps in the heatmaps (above). The gaps indicate no vehicles travelled through that section of road for that period.

Bullock was interviewed on Compass' Byte Size podcast to discuss how connected vehicle data can help authorities to improve performance, from real-time congestion analysis to long-term corridor planning strategies.


Related Content

  • Data collection key to software developments
    February 13, 2012
    The collection and handling of data are key technology drivers in the software sector. New methods of data collection and manipulation are driving significant developments in software at present. The latest technology allows designers and engineers to collect, store and manipulate ever larger amounts of data. Growing use of mobile field equipment for both data collection and field management is driving interactive systems. And in an interview this month Autodesk senior vice-president for the construction an
  • $21.85 billion for South Africa road upgrades
    March 5, 2025
    $21.85 billion will be spent on South African road upgrades.
  • Securing safer transportation infrastructure through non-destructive technology
    June 16, 2014
    Kevin Vine reports on the use of non-destructive testing for structural analysis of bridges Seven years ago, the overpass collapse in Laval, Québec that led to the death of five people brought to light severe issues with the state of the country’s bridges and transportation infrastructure. More recently, a crack in the Champlain Bridge to Montreal that forced over 160,000 commuters to find alternate routes to work reaffirmed a need for greater emphasis on early detection before a crisis occurs.
  • Indra chooses Citilog for Silvertown Tunnel
    June 28, 2024
    Citilog will integrate its automatic incident detection (AID) system to help reduce congestion in and around the tunnel between the London borough of Greenwich, the peninsula area, and West Silvertown.