Low income countries account for only 3% of global road networks: a constraint for economic growth

An analysis of road network data from IRF World Road Statistics (WRS) reveals the low percentage of road networks in low income countries and underdeveloped regions of the world. These results link poor quality roads and lack of road infrastructure to constrained economic development and growth The IRF World Road Statistics (WRS) includes up-to-date data on the road and transport sector for over 200 countries and covers nine important road topics, one of which is road networks. An analysis of the road
January 15, 2019 Read time: 3 mins
Source: IRF WRS 2018, latest year of available data for countries
An analysis of road network data from IRF World Road Statistics (WRS) reveals the low percentage of road networks in low income countries and underdeveloped regions of the world. These results link poor quality roads and lack of road infrastructure to constrained economic development and growth


The 1201 IRF Geneva World Road Statistics (WRS) includes up-to-date data on the road and transport sector for over 200 countries and covers nine important road topics, one of which is road networks.

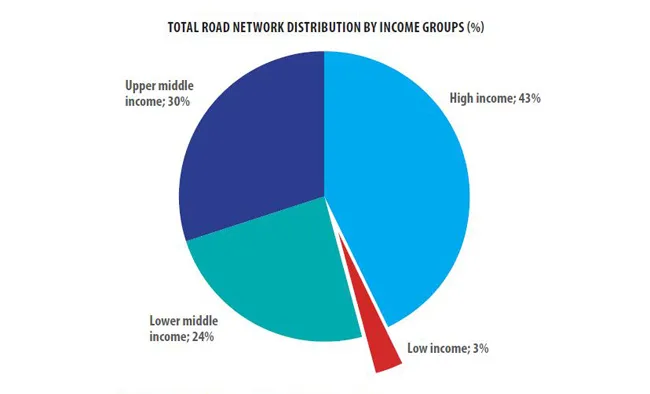
An analysis of the road network data reveals that low income countries account for just 3% of global road networks. With such a small percentage of road networks, low income countries have limited economic growth potential.

A reliable road network is vital to any country, and is especially important for low income countries, because a strong road network can lead to massive economic development benefits. Roads help economies grow by linking markets and allowing the flow of goods, people and services.

Available data provided by the WRS 2018 include the total length of road networks (in km) for each country. This total is broken down into smaller subsections that include: motorways, highways (main or national), secondary (or regional), and other roads. The WRS also categorises countries by geographic region and income group. The analysis of the road network data relating to a country's income group highlights a stark contrast in road network percentages:

• High income countries account for 43% of global road networks while low income countries account for only 3% of them.

The pie chart below above shows the total road network distribution by income group for the latest year of available data.

Source: IRF WRS 2018, latest year of available data for countries

The highest income group has the largest percentage of road networks followed by the upper middle income group, the lower middle income group and finally the low income group with the lowest percentage. The lack of funding and resources for new road networks combined with the absence of maintenance for roads that do exist in low income countries have led to infrastructure deficits and little economic growth. These deficits are partially responsible for preventing low income countries from moving into higher income groups. It is also important to look at the road network distribution by geographic region because the geographic regions of the world that are underdeveloped are usually those of low incomes. The pie chart below shows the total road network distribution by geographic regions of the world.

Source: IRF WRS 2018, latest year of available data for countries

The key statistic to take away from this chart is Sub-Saharan Africa’s low percentage of road networks; it is just 6% in stark comparison to representing 17% of global land mass. Poor roads and infrastructure in this region make delivering goods and services a difficult task for businesses and individuals. According to data available, annual public spending on infrastructure was only 2% of GDP in 2009–15. Sub-Saharan Africa needs to invest billions of US dollars into its infrastructure. Until Sub-Saharan Africa is able to fund significantly higher road infrastructure construction and maintenance, the isolation caused by lack of well-developed and well-maintained road networks will continue to pose a key constraint to achieving the 2030 Sustainable Development Goals.


The new WRS 2018 encompass updated data on over 200 countries: Country Profile, Road Networks, Road Traffic, Multimodal Traffic Comparisons, Vehicles in Use, Road Accidents, Vehicles Industry (Production, Imports, Exports and First Registrations), Road Expenditures & Revenues, and Fuel Energy Prices.

For more information on companies in this article

Related Content

  • Poor road safety worldwide poses a cause for concern
    December 7, 2018
    Poor road safety worldwide is a serious cause for concern, with thousands being injured or killed across the glove every single day. The issue is highlighted by a new report by the World Health Organisation (WHO). This indicates road traffic deaths continue to rise, with annual road fatalities now reaching 1.35 million, compared with 1.25 million just three years ago. The WHO Global status report on road safety 2018 highlights that road traffic injuries are now the leading killer of children and young peo
  • Supporting road safety data collection in EuroMed Region
    December 13, 2018
    Dr Cristian Gonzalez, director IRF World Road Statistics, was in Athens to share IRF’s expertise in data collection at a three-day regional workshop organised by the EuroMed Transport Support Project. The event offered a novel opportunity to share national, European and international experiences and best practices with road safety data and allow a regional exchange on setting up a road map for the follow-up actions. The Workshop hosted 40 experts, of which 25 from EuroMed Partner countries. The “EuroMed T
  • OECD countries invest average 1% GDP on road/rail infrastructure
    July 11, 2013
    OECD (Organisation for Economic Co-operation and Development) countries investment in road, rail and inland waterway infrastructure as a percentage of GDP averages around 1%, according to new research by the International Transport Forum (ITF). The figure is contained in the ITF at the OECD’s 2013 annual statistics update ‘Spending on Transport Infrastructure 1995-2011: Trends, Policies, Data’, which is accompanied by a related database, released today.
  • Analysing green Australian procurement practices
    December 16, 2014
    Adriana Sanchez and Keith Hampson of the Sustainable Built Environment National Research Centre (SBEnrc) discuss green procurement Procurement has a key role impacting the lifecycle of a construction project and can serve to drive many sustainability outcomes. Green procurement in particular can be used as a strategic tool to promote certain behaviour and as an environmental policy instrument to translate environmental policies into environmentally sustainable project processes, products and services. Th